


 63 / 214

63
FINANCIAL STATEMENTS AND MANAGEMENT REPORT 2015
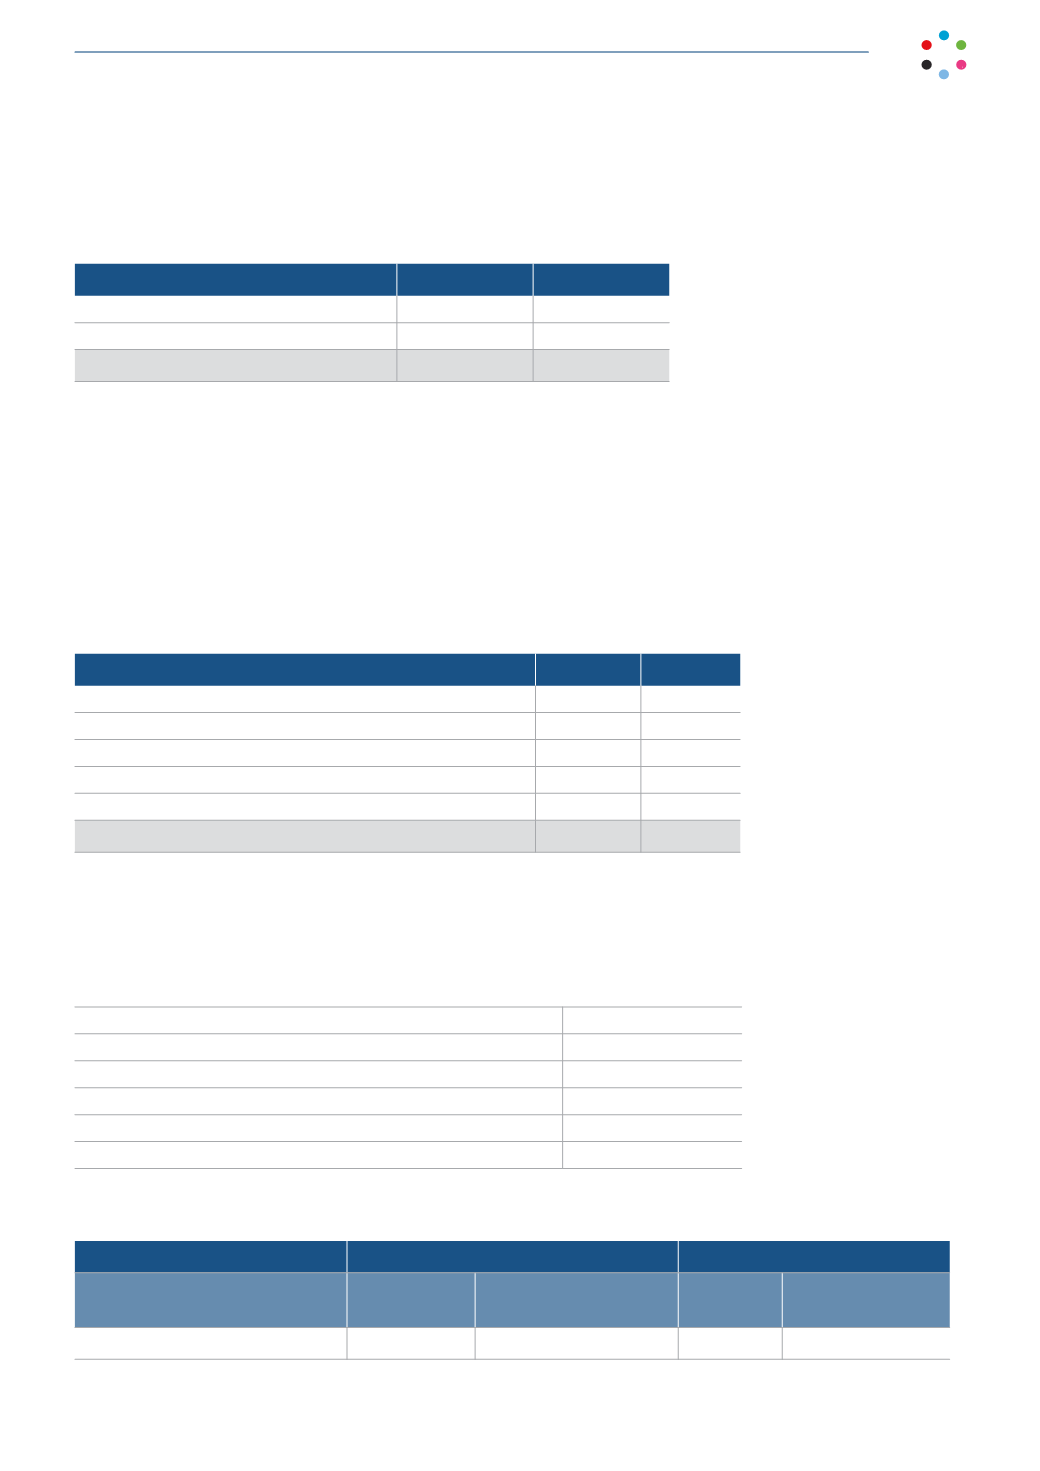
9. INVENTORIES
The balances under this heading at year end are as follows:
2015
2014
Prepayments to program suppliers
463
307
In-house production programs
6,080
1,248
Total
6,543
1,555
10. TRADE AND OTHER RECEIVABLES
The breakdown of trade and receivables in 2015 and 2014 is as follows:
12/31/15 12/31/14
Trade receivables
4,705
4,920
Receivables from Group companies and associates (Note 19)
211,276
199,560
Other receivables
399
5
Receivables from employees
138
105
Current income tax assets (Note 15)
9,413
12,459
225,931 217,049
Impairment losses:
The balance of trade receivables is shown net of impairment loss allowances.The variations in 2015 and 2014 in these
impairment losses are as follows
Thousands of euros
Cumulative impairment losses at January 1, 2014
7,510
Charge to the income statement
(371)
Cumulative impairment losses at December 31, 2014
7,139
Cumulative impairment losses at January 1, 2015
7,139
Charge to the income statement
171
Cumulative impairment losses at December 31, 2015
7,310
The breakdown of trade receivables denominated in foreign currency, for 2015 and 2014, is as follows:
2015
2014
ASSETS
Dollars
Balance in euros at
12/31/15
Dollars
Balance in euros at
12/31/14
Trade receivables
83
77
496
408