


 53 / 214

53
FINANCIAL STATEMENTS AND MANAGEMENT REPORT 2015
8. FINANCIAL INSTRUMENTS
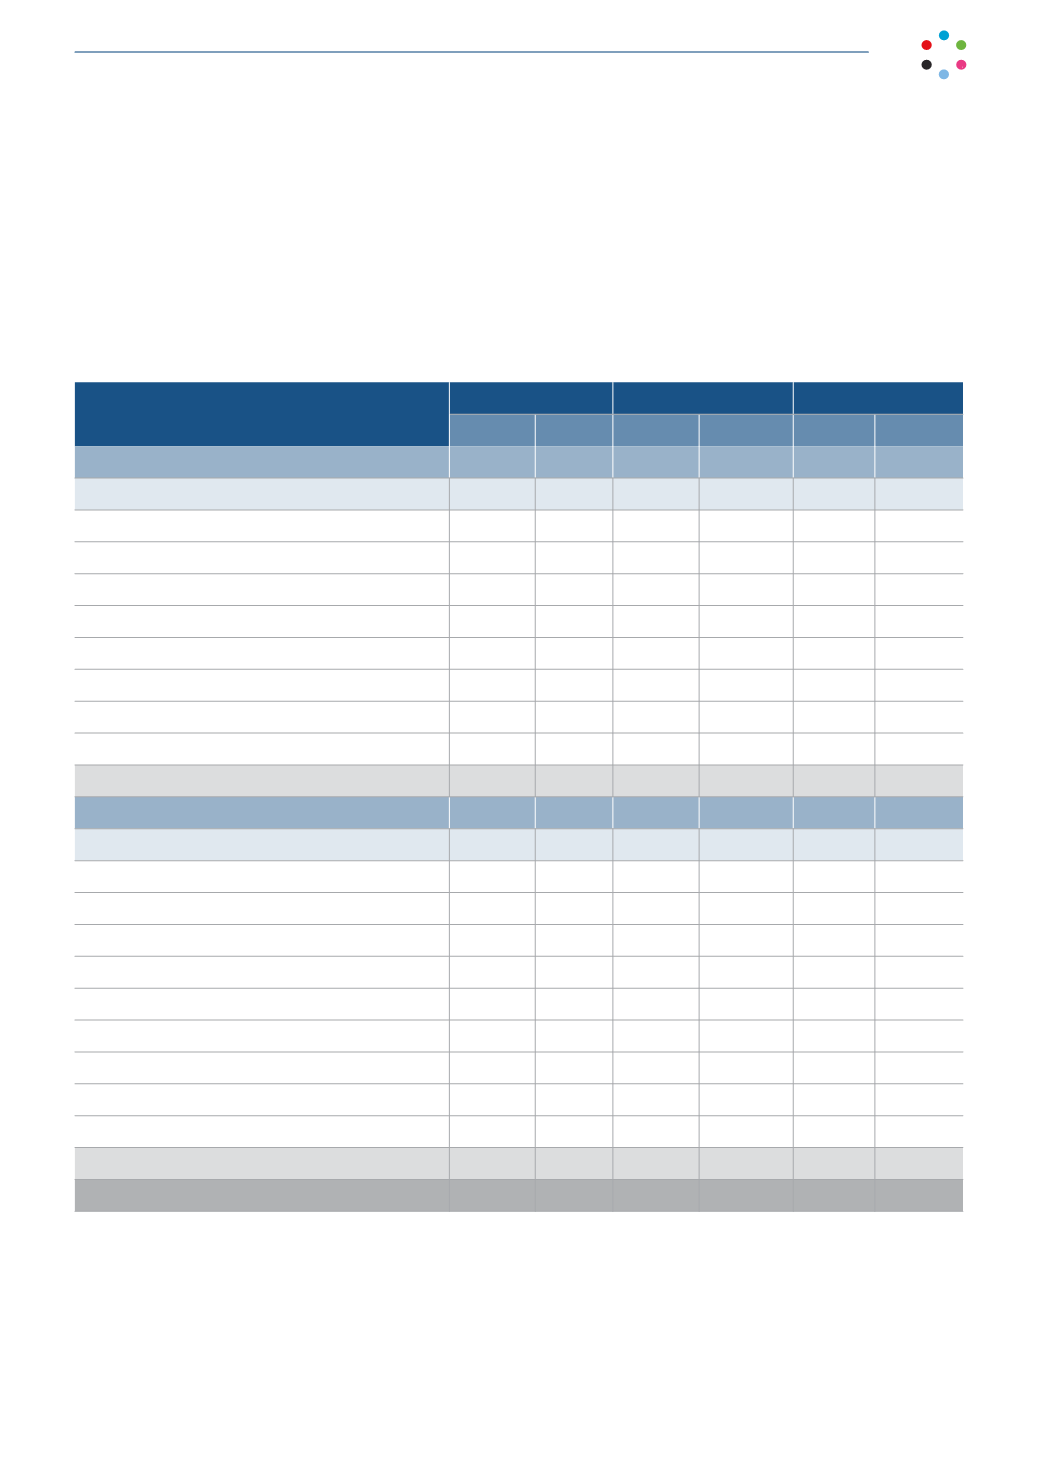
8.1. Financial Assets
The breakdown of financial assets in 2015 and 2014 is as follows:
Thousands of euros
Equity instruments
Debt securities
Total
2015
2014
2015
2014
2015
2014
Non-current financial assets
Assets at fair value through profit or loss
-
Held for trading
-
-
-
-
-
-
Other
-
-
-
-
-
-
Held-to-maturity investments
-
-
-
-
-
-
Loans and receivables
-
-
26,621
57,577 26,621 57,577
Available-for-sale financial assets
-
-
-
-
-
-
Measured at fair value
-
365
-
-
-
365
Measured at cost
-
-
-
-
-
-
Hedging derivatives
-
-
-
-
-
-
Total
365 26,621
57,577 26,621 57,942
Current financial assets
Assets at fair value through profit or loss
Held for trading
-
-
-
-
-
-
Other
-
-
-
-
-
-
Held-to-maturity investments
-
-
-
-
-
-
Loans and receivables
-
-
282,235 247,865 282,235 247,865
Available-for-sale financial assets
-
-
-
-
-
-
Measured at fair value
-
-
-
-
-
-
Measured at cost
-
-
-
-
-
-
Non-current assets held for sale
-
7,932
-
-
-
7,932
Hedging derivatives
-
-
866
1,193
866
1,193
Total
-
7,932 283,101 249,058 283,101 256,990
-
8,297
309,722 306,635 309,722 314,932